A Practical, Engineer-Grade Tour of How Java Really Runs
Java’s “Write Once, Run Anywhere” magic is made possible by the Java Virtual Machine (JVM) — a carefully engineered runtime that turns .class files into live processes, manages memory, enforces safety, and extracts native performance through adaptive compilation. This post walks through the JVM’s internal components with compact, technically precise explanations you can use when debugging, tuning, or architecting JVM-based systems.
Table of contents
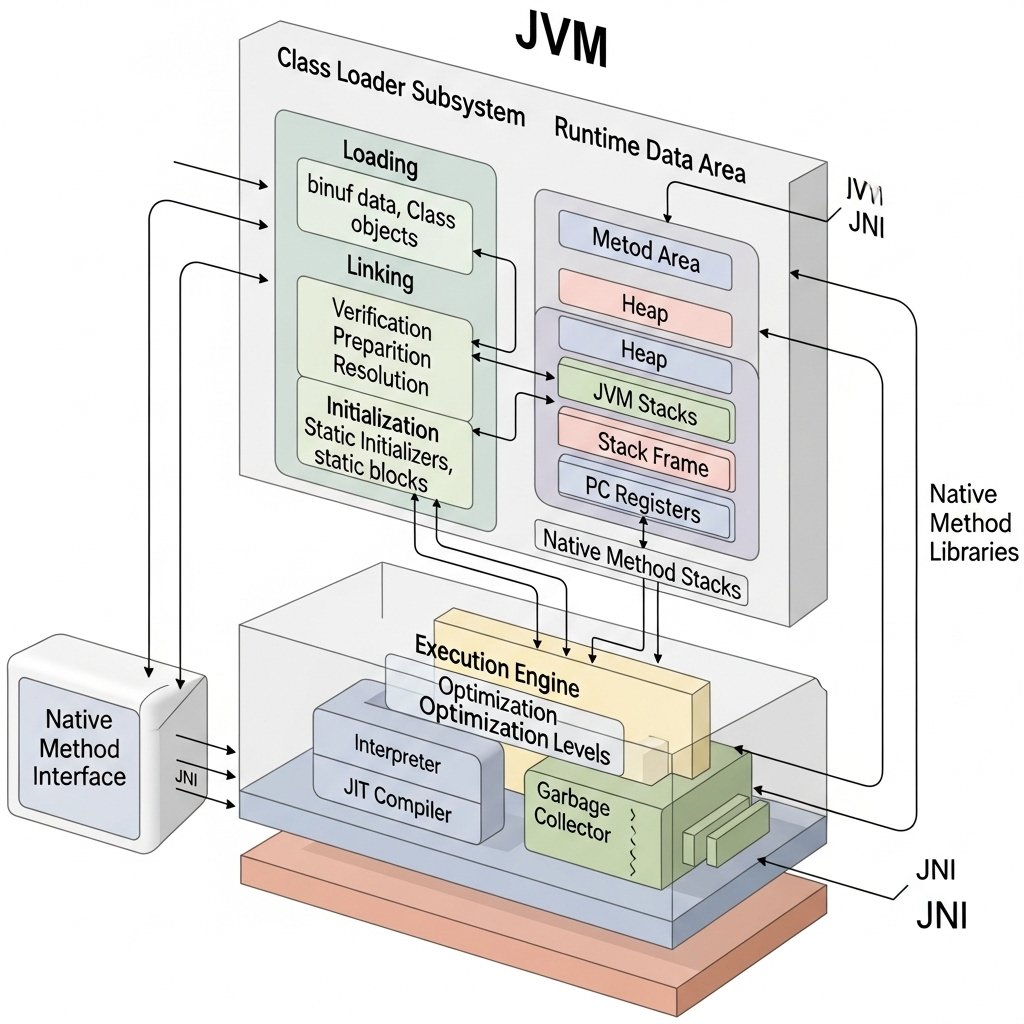
Class Loader Subsystem
The Class Loader Subsystem is the JVM’s code ingestion and namespace manager. It takes binary class data and makes java.lang.Class objects available to the rest of the runtime. Class loading is dynamic and happens on-demand; understanding its three-phase lifecycle (Loading → Linking → Initialization) is essential for diagnosing ClassNotFoundException, NoClassDefFoundError, LinkageError, memory leaks caused by undeployed applications, or plugin/hotswap issues.
1) Loading
What it does: Reads class bytecode (from .class files, JARs, network, or generated in-memory) and turns it into a Class object.
How it’s triggered: APIs like Class.forName, ClassLoader.loadClass, reflective access, or the JVM when resolving symbolic references.
Where it comes from: Class loaders implemented in Java (java.lang.ClassLoader) or in native code (bootstrap loader). You can write custom class loaders to isolate plugins or support dynamic languages.
2) Linking — three sub-steps
Linking prepares a newly loaded class to be used by the JVM. It has three deterministic sub-steps:
Verification — Ensures bytecode conforms to the JVM specification and doesn’t violate type-safety or memory-safety rules. This step defends against malformed or malicious bytecode and detects many class-format or bytecode-level errors early.
- The verifier checks stack-map frames, type correctness, correct use of opcodes, and other low-level constraints required by the JVM spec.
Preparation — Allocates memory for static fields and sets them to default values (zero, null, false) but does not run static initializers (that’s initialization). This is where the class-level layout is established: field slots, method tables, constant pool references, and internal metadata.
Resolution — Lazily or eagerly replaces symbolic references in the constant pool with direct references (pointers/handles) to other classes, fields, and methods. Resolution can trigger additional class loads; depending on JVM implementation, resolution may be deferred until an actual access occurs (lazy) or done during linking (eager).
3) Initialization
What runs: JVM executes the class’s method — the compiled sequence of static initializers and assignments. For instance, static { ... } blocks and direct static field initializers are combined into .
Initialization semantics:
Before a class is initialized, its superclass is initialized first (unless the superclass is Object).
The JVM guarantees runs at most once per class loader and in a thread-safe manner: if one thread triggers initialization, other threads attempting to use the class will block until initialization completes.
If throws an exception, the JVM wraps it in ExceptionInInitializerError and the class is considered erroneous — subsequent initialization attempts will fail.
When it happens: Initialization occurs at first active use (new instance creation, static method invocation, or reading a static field), though some reflective operations can force it earlier.
Parent Delegation & Namespaces
Parent Delegation Model: By default, a class loader asks its parent to load a class before attempting to load it itself. This avoids duplicate core classes and improves security (core runtime classes are resolved by bootstrap loader).
Why it matters: Custom class loaders that break parent delegation can cause duplicate classes (same binary name but different Class objects), leading to ClassCastException even when types look identical.
Namespaces: Each class loader defines a namespace. Two classes with the same binary name loaded by two different loaders are distinct types.
Class Unloading
When: A class (and its associated metadata/metaspace memory) can be unloaded when its ClassLoader becomes unreachable and there are no live references to any classes or instances from that loader. HotSpot relies on GC to collect such classloaders and reclaim metaspace.
Common leak source: Holding static references to classes from a webapp or plugin prevents classloader GC, leading to memory leaks (permanent generation/metaspace growth).
Real-world caveats & uses
Hot-deploy frameworks / OSGi / application servers intentionally use custom loaders to isolate deployed modules and allow independent lifecycle management.
Security: Verification + delegation protect the core runtime; custom loaders require careful design to avoid privilege escalation.
Debugging: ClassNotFoundException, NoClassDefFoundError, LinkageError, and ClassCastException are often classloader problems — examine loader hierarchies and ClassLoader identity.
Runtime Data Areas (memory model)
The JVM specification defines logical runtime areas the JVM uses while running Java code. HotSpot maps these to concrete memory regions with several implementation-specific optimizations.
Method Area (conceptual): Holds per-class structures: runtime constant pool, method bytecode, field and method data, and class-level metadata. In HotSpot, much of this concept is stored in Metaspace (native memory) since Java 8; historically it was the PermGen.
- Note: metaspace is allocated from native memory; its sizing and growth behavior differ from the heap.
Heap Area: Stores all Java objects and arrays. The heap is shared across threads and is the primary target of the Garbage Collector. Modern heaps are generational (young/eden, survivor, old/tenured) to optimize for object lifetimes.
Java Stacks (per-thread): Each thread has its own stack made of frames. A frame contains local variables, operand stack, and a reference to the method’s runtime constant pool. Stack frames are created for every method invocation and popped on return; stack overflow occurs when thread stack exceeds JVM limits.
PC (Program Counter) Register (per-thread): Holds the address of the JVM instruction currently being executed for that thread. For native methods, this may be unspecified.
Native Method Stack: Used when invoking native methods (JNI). On some JVMs this is unified with the Java stack; on others it is separate. Native stacks are subject to OS thread limits.
Execution Engine (interpreter, JIT, code cache)
The Execution Engine is where bytecode turns into CPU-executable work. JVMs strike a balance between fast startup and long-term performance through multiple execution strategies.
Interpreter: Executes bytecode instructions directly. Interpreters start programs fast (no compilation cost), ideal for short-lived tasks or cold code paths.
JIT Compiler (Just-In-Time): Detects frequently executed methods (“hot spots”) and compiles them into native machine code. Modern JVMs use tiered compilation: a quick optimizing compiler for short-term gains and a highly optimizing compiler for long-running hot methods.
HotSpot specifics: historically offered C1 (client) and C2 (server) compilers. Newer ecosystems integrate GraalVM as a high-performance JIT/AOT compiler option.
Adaptive optimization: runtime profiling (method invocation counts, branch frequency, type profiles) informs aggressive inlining, escape analysis, and other optimizations.
Code Cache: Native machine code produced by the JIT is stored in a code cache. The code cache has limited size; exhaustion causes deoptimization or compilation failures.
Deoptimization / Recompilation: If assumptions made during JIT (e.g., a virtual call target) are invalidated at runtime, the JVM can deoptimize compiled code and fall back to interpreter or recompile with new profiling information.
Garbage Collectors & Memory Management
GC is a cornerstone of JVM internals — responsible for reclaiming heap memory safely and with minimal pause impact.
Generational collectors: exploit the observation most objects die young (Eden → Survivor → Old).
Common HotSpot collectors (examples): Serial, Parallel (throughput), CMS (older low-pause approach), G1 (default in many modern JDKs — region-based, concurrent marking), ZGC and Shenandoah (low-pause, concurrent collectors aimed at very large heaps).
Metrics & tuning: GC logs, jstat, jmap, jcmd, and JVM flags (-Xmx, -XX:+UseG1GC, etc.) are the primary tuning levers. Tuning involves trade-offs between throughput, pause times, and memory footprint.
Native Method Interface & Native Libraries
JNI (Java Native Interface)
Purpose: Enables Java code to call (and be called by) native code written in C/C++ (or other languages) for platform integration, performance-critical functions, or reusing legacy libraries.
Mechanics: Java declares native methods; the JVM resolves and links them to functions in native libraries (via System.loadLibrary or System.load). JNI provides JNIEnv* handles, lifecycle hooks, and functions to manipulate Java objects from native code.
Trade-offs: Native code bypasses JVM safety and managed memory, so bugs in native code can crash the JVM, leak memory, or corrupt heap. JNI calls also have overhead — use them sparingly for narrow, expensive operations.
Native Libraries
Formats: .dll on Windows, .so on Linux, .dylib on macOS.
Loading: System.loadLibrary("foo") loads the platform library named foo. Libraries are linked to the process and can be used by multiple class loaders but care must be taken for native state shared across modules.
Runtime Services: Threads, Synchronization, and Monitors
Thread model: JVM maps Java threads to OS threads (1:1 model in HotSpot). Thread creation costs and OS scheduling characteristics influence concurrency design.
Monitors & synchronized: JVM implements monitors (enter/exit) using lightweight structures and optimizations like biased locking and lock coarsening to reduce contention overhead.
Volatile and Memory Barriers: volatile enforces memory visibility through memory fences; the JVM emits architecture-specific barriers to provide the Java Memory Model guarantees.
Lock contention tools: jstack, jcmd Thread.print, and profilers help identify deadlocks and hotspots.
End-to-end flow: from .class to CPU cycles
Class load request (e.g., new, Class.forName) reaches a class loader.
Loading reads the bytecode and creates a Class representation.
Linking verifies the bytecode, prepares static structures, and resolves references.
Initialization runs , producing initialized static state.
Execution: interpreter or JIT runs methods; JIT compiles hot methods to native code and stores them in the code cache.
Runtime services (synchronization, JNI calls) interact with OS-level threads and libraries.
Garbage Collector reclaims unused heap objects; class unload can occur if classloaders become collectible.
Monitoring & tooling expose runtime state for profiling, debugging, and tuning.
Practical tips, debugging, leaks, and tuning
Classloader leaks: common in app servers when classes or threads from an old deployment remain referenced. Use heap dumps (jmap -histo, jcmd GC.heap_dump) and analyze references to classloader instances. Avoid static references to application classes held by shared utilities.
Startup vs steady-state: Use tiered compilation settings and AOT or Graal to improve startup if needed.
GC pause troubleshooting: enable GC logging (-XX:+PrintGCDetails -Xlog:gc* in modern JDKs), analyze pause times, and consider switching collectors (G1 → ZGC/Shenandoah for very large heaps and low pause requirements).
Classloading errors: print classloader hierarchies and the origin of classes (Class.getClassLoader(), -verbose:class JVM flag) to see where a class came from.
Native crashes: enable core dumps and use platform debuggers; recall that JNI bugs can crash the entire JVM.
Further reading & references
The Java Virtual Machine Specification — definitive behavioral semantics for class loading, linking, and initialization.
HotSpot Internals & JVM Tuning guides — for implementation details like metaspace, GC algorithms, JIT compilers, and flags.
GraalVM docs — if you’re exploring alternative JIT/AOT paths.
Common tools: jcmd, jmap, jstack, jstat, jinfo, and profilers (async-profiler, YourKit, Flight Recorder).
Closing note
Understanding JVM internals — especially class loading semantics (loading → verification/preparation/resolution → initialization) and the memory/execution model — gives you concrete levers for diagnosing runtime issues and improving performance. The JVM is an evolving ecosystem (e.g., metaspace, Graal), but the core lifecycle and responsibilities of its subsystems remain consistent and immediately useful in day-to-day engineering.
Note: This content and image were generated with the assistance of AI. For any issues or concerns, please contact contact@razorblack.me.